The Graphite story @ Directi
At Directi, we use graphite as one of our principal monitoring tools. Initially, when Graphite set its foot into the company’s monitoring system, the setup was a cinch where one server was dedicated to receive metrics data, render the graphs and serve it to the requesting users. The problem with this setup was pretty much like a talking turkey, that it hit the bottleneck when the amount of metrics sent to this server became significantly high. This’d result in carbon-relay and carbon-cache instances on the system consuming a lot of CPU and Memory leaving not much resources available for the webapp and WSGI Daemon to use. This indubitably resulted in performance issues with rendering the graphs. It literally took a minute to render each graph. And when we perform some functions(provided by graphite) over the graph data, it’d almost take a minute and a half or more to render the graph. I’d have a coffee-break in the time my dashboard loads.
The primary bottleneck that we were facing was the disk I/O - as faced by every damn graphite beginner out there in the dev-ops team. So we decided to use SSDs on the server. But, it wouldn’t be a cheap solution to replace all rotational drives with SSDs, because, we’d require a hell a lot of storage to store that much amount of whisper data. But we didn’t want to sacrifice the power and advantage of SSDs. Flashcache came to the rescue. Flashcache is a block-cache for Linux. It helps extending Linux block-cache with a SSD drive. It is cheaper than buying half a TB of RAM and 5 TB of SSD drives. After a few tests and try-outs with flashcache, we decided to use write-back caching mode. In write-back mode, all writes go to the cachedev (SSDs) initially, and based on few policies, they are written to the disk later. All disk reads are cached. It’s determined and documented to be the fastest mode to write and is pretty unsafe. We really didn’t care much about the safety of the data received, because, even if we lose a few metric points, it’s not that big a deal to be significantly important.
Once flashcache was up and doing its work properly, we started to enjoy the bounty of the performance improvements with respect to IOPS. During this time, metrics were sent from 100s of servers, and the maximum number of metrics per minute reached a value of 300k. A single carbon-relay instance was able to handle this much load i.e. it held the incoming metrics in its queue and relayed it to the 3 carbon-cache instances on the same system. At this time, relay was not our bottleneck. Meanwhile, when planning to experiment and expand this setup to serve greater extents, we faced this NFC (abbreviated as No F**king Clue) issue with flashcache - Kernel Panic on system reboot OR halt. Every time we rebooted graphite server, during halt scripts’ execution, KERNEL panic occurs. NFC!!!. It’s not that easy to understand the Kernel Panic logs the first time you see it. It’s exactly the same thing as reading a bunch of scattered items from a pool of hexadecimal values. Investigating further, we developed experience on “How to” and “How not to” use flashcache, but none of these solved our Kernel panic issue. Finally, there came a moment, where we had to dig through Linux’s halt process and confirmed that flashcache was the culprit. When the halt process was happening, removing the Logical Volume using dmsetup wouldn’t happen automatically. The halt script would just try to unmount whatever is on its way to completing the shutdown process. So we plugged in a SysVInit script as a hook that is invoked by the halt script when it sees a flag for flashcache in subsys. This init script is responsible for loading and removing the LV. While removing we need to consider whether or not to sync the data between the cache and the backend disk. This is determined by the sysctl flag “fastremove”. However, the default behaviour on a remove is to clean the dirty cache blocks to disk and the remove will not return until all blocks are cleaned OR in simple terms - Setting the fastremove option to 0, flushes the cached data to the backend disk and setting it to 1, the cache would still have uncommitted dirty blocks.
With this setup, the graphite server with a dozen cores CPU, and a dozen gigs of Memory was receiving and replying fairly well for sometime until we hit the next bottleneck with carbon-relay process. At an average, the graphite server received 300k metrics, and the sender script used plain TCP connection for every line of the metric. We didn’t require aggregation for most of the metrics, since preserving the individual values mattered. The problem with the Carbon agents was that the number of file descriptors got exhausted and they were not able to open any more files to write to. This resulted in an increase in the queue size of relay. And this hit the limit as set in carbon.conf under relay section. I remember the queue size to be around 5000 data points. At this point, relay started throwing errors onto its console. The error said - “Could not accept new connection (EMFILE)”. EMFILE refers to the shortage of file descriptors available to that particular process, here, carbon-cache. So, we increased the ulimit from 1024 to 4096 for the session that initiated the carbon-daemons. But this wasn’t sufficient. So, we increased it to 10240, and increased the queue size to 10000. The relay started accepting connections, and everything was back to normal. Not so fast buddy? To where? A stable graphite setup ? Huh. You know that’s insanity. By the time we realized that we had to handle a larger load, relay started trembling again. The root cause for this was a bug in the metric collector scripts. The collector scripts works in a way that it doesn’t send to graphite immediately. We do some caching on every client system, where we write all the collected metrics to a temporary device, and a cron reads the cached metrics and flushes it to the graphite server. When this cron is not able to establish the TCP connection, the metrics remain in the cache file - cluttering. When the bug was fixed, the amount of cached metrics emerging from 100s of servers was more than twice the average value (around 800k). At this point, relay had no other choice but to stop accepting metrics. A quick fix that we discovered was to restart relay when the number of metrics it accepts goes below a critical value. After some analysis, 4hrs seemed to be a fair value. So we kept restarting relay every 4 hours, a graph of which would explain the failure of the process gradually.
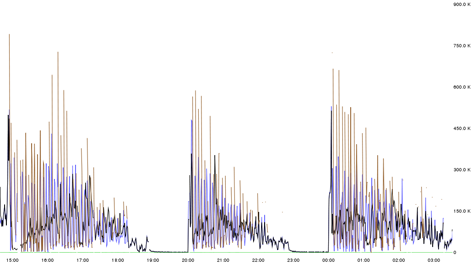
In this way, we reached to some arbitrary solution, where we tweaked the collector scripts to send lesser number of metrics. At this point, it’s quite obvious that graphite server was hitting the bottleneck every 4 hours. The average amount of metrics received is around 300k, but the graph shows 750k metrics everytime carbon-relay starts accepting all the connections made to it. The reason for this to happen is the caching mechanism we follow on the client systems. So all those metrics which failed to get into graphite would still be there on the clients. The next cron would try to push it, but graphite just wouldn’t accept any more connections. So when relay is restarted, graphite starts fresh, and memory is literally empty where it can accept all the connections made to it. That’s why we could see a spike to 750k data points every time relay starts fresh.
Moving on the the next step in optimizing, we decided to put relay on a separate system, so that carbon-cache would have enough system resources to write to whisper files, while, on the other hand, relay would also have enough system resources to maintain a larger queue size as well as accept a larger number of connections. So we cloned relay to a new system graphite02 which was an exact clone (in system configuration) of graphite01. We initiated relay on graphite02, and it seemed to have solved the problem. All the cached metrics were accepted by the graphite02 relay continuously without any interrupts and they were relayed to carbon-cache instances on graphite01. A graph of that found below would explain that the area covered by the red lines was the initial load that graphite01 should have bared to be stable.
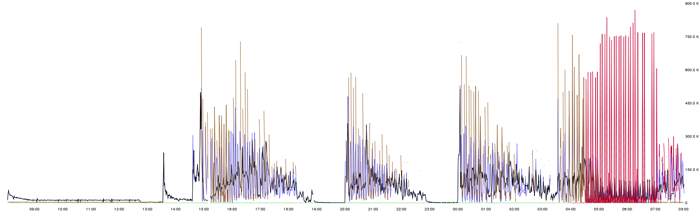
An obvious analogy corresponding to the area mapped and area unmapped between two spikes can be found to correlate with the area mapped by the red region. And after all the cached metrics are sent, the rate of metrics reception becomes normal to a value of 200k per min. So, as mentioned earlier, all that graphite needed to handle was the initial spike (cached data points).
Here comes the situation, where we feel that we aren’t using the system resources completely. We had two servers dedicated to monitoring, each had a dozen cores CPU and a dozen gigs of RAM, and SSDs and flashcache. So the next thing to try is to make this setup a cluster and load balance the carbon-agents and the webapp. Initial thoughts was to make it a High Availability cluster using corosync. But, we wanted to do things simpler than that. Graphite, by itself, provides a mechanism to load balance all the services and the webapp. They call it “The Federated Graphite Setup”. We read through some of the blog posts and launchpad answers and started tweaking carbon.conf and local_settings.py in graphite webapp. The graphite cluster now contained two servers, each running a relay, three carbon-cache instances, and the graphite webapp. Flashcache was setup on graphite02 too in a similar manner as present in graphite01. The relays are configured to feed its queue to all the 6 carbon-cache instances on the two systems. The issue is to determine which relay would serve the need, but the aim is to use both the relays. First tryout was that one relay(graphite01) received the metrics and relayed them to the relay on the other system(graphite02) and this load balanced between the 6 carbon-caches. The relay on graphite01 was configured to occupy more memory - bigger queue, and relay on graphite02 (second stage) was configured to occupy a lesser memory. This setup wasn’t that appreciable. So we decided to load balance before the data points reach relay. HAProxy solved our issue. We configured HAProxy to load balance between graphite01 relay and graphite02 relay, each of which would further load balance between 6 carbon-caches.
Our next issue was with syncing the old metrics to the new system. We hit one more bottleneck where syncing between two production systems that is live becomes impractical. The root cause for this problem is the load balancing technique used. We used roundrobin in HAProxy and consistent-hashing in graphite relay. To understand consistent-hashing, consider the 6 carbon-cache instances to be the slots and the data-points to be the keys K. So, on an average only K/6 keys need to be remapped. This splits the relay’s incoming load almost equally to the 6 carbon-caches. On seeing a data-point, carbon would know where it’d get relayed to. (perks of consistent-hashing). Some of the metrics got relayed to graphite02 creating new files on graphite02 while leaving the files on graphite01 untouched. The old data which was already present on graphite01 should be merged with the new incoming metrics which didn’t happen automatically. Also graphite has this sick mechanism that if a whisper file is present in the same system the webapp is running, it wouldn’t query the other systems for the data. So the only way to solve this issue is to copy the old data to the new system, apply the consistent hash manually upon all the files, and unlink them if they don’t belong there. But we hit the bottleneck right at the first step - syncing data between the two servers. Started rsyncing the data, and estimated the time to complete. The value that appeared really shook my head - 10 days, which is impractical to be done on a live production system. So we decided to keep only few important metrics, rsync them and clean the files based on consistent hashing applied by carbon. The syncing was done, and some of the important metrics were retained, and the performance of the cluster was amazing that it could handle 4x load. We also increased the number of carbon-cache instances to 6 on each system. I would like to share an infographic of our setup.
I know it’s a very long post. One of the conclusions that we arrived at one point was to completely chuck graphite as the monitoring system, and use OpenTSDB. But it doesn’t provide enough functions like graphite does. And graphite is a really good project that I just can’t let it go. Now I’m trying out ceres database to use it in the place of whisper. Will blog about the same some time later ;). Thank you for reading till here.